Introduction A patent is a unique privilege given for an invention, whether it be a…
Growing efficiency of Patent Prosecution in India – Comparative Study (2015 through 2017)
Patents have been a very functional and important aspect of Intellectual Property Rights (IPRs). They are also one of the oldest laws of IPR that have been prevalent in India since 1856. However, after lot of repeals and amendments, the final draft was introduced as Patent Act, 1970, which came into force in 1972. This Act and Patent Rules also went through a lot of amendments, the last amendment being in March -2016, in furtherance to the establishment of the National IPR policy.
One key objective of these developments in the IPR field has been to increase and strengthen the IPR laws, and also to enhance the procedure of Patent registration. However, these changes and amendments have not only given incentives to the inventors to get their works patented, but have also built up their faith in the administrative bodies (Patent office) that are involved in the grant/issuance of Patents.
As is known, the Indian Patent Office is spread over four locations, namely Delhi, Mumbai, Kolkata and Chennai that administer the laws concerning protection of inventions in the country by way of grant of exclusive rights in the form of Patents to the Applicants for a limited period.
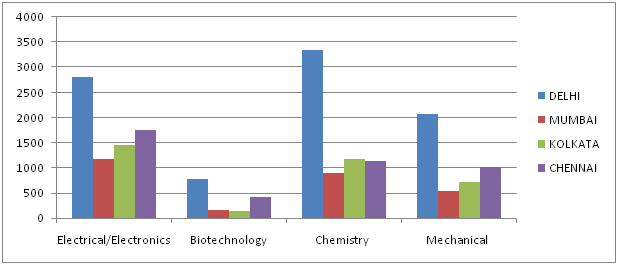
Following are the charts of the First Examination Reports (FERs) that have been issued in the year 2015, 2016 and 2017.
Fig 1: FER issued in 2015 against each category
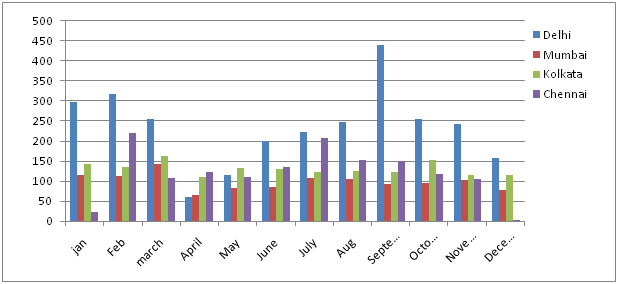
Fig 2: FER issued in 2016 against each category
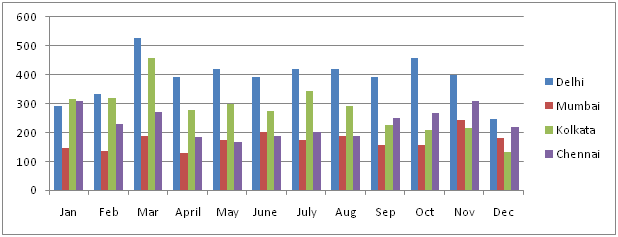
Fig.3: FER issued in 2017 against each category
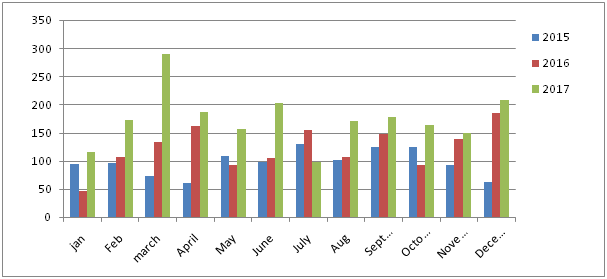
Fig.4: Comparative graph showing FER issued during three years
By perusing the above graphs, it is quite evident that the offices have largely worked at par in the year 2015 and 2016. However, in the year 2017, Patent offices have shown considerable surge in the issuing of examination reports when compared to previous years. Therefore, it can be safely inferred that the recent amendments and developments in the Indian Patent laws have brought about a positive change in functioning of the Patent prosecution, thereby building trust and faith of the inventors as well as of Applicants who file their Patent Applications in India, thereby complying with the National IPR policy.
NUMBERS OF FERs ISSUED IN EACH PATENT CATEGORY (MONTHLY)
EVALUATION OF THE YEAR – 2015
Fig. 5 : Number of FERs issued in Electrical/Electronics Domain in 2015
Fig.6: Number of FERs issued in Biotechnology Domain in 2015
Fig. 7: Number of FERs issued in Chemistry Domain in 2015
Fig. 8: Number of FERs issued in Mechanical Domain in 2015
EVALUATION OF THE YEAR – 2016
Fig. 9: Number of FERs issued in Electrical/Electronics Domain in 2016
Fig. 10: Number of FERs issued in Biotechnology Domain in 2016
Fig. 11: Number of FERs issued in Chemistry Domain in 2016
Fig. 12: Number of FERs issued in Mechanical Domain in 2016
EVALUATION OF THE YEAR – 2017
Fig. 13: Number of FERs issued in Electrical/Electronics Domain in 2017
Fig. 14: Number of FERs issued in Biotechnology Domain in 2017
Fig. 15: Number of FERs issued in Chemistry Domain in 2017
Fig. 16: Number of FERs issued in Mechanical Domain in 2017
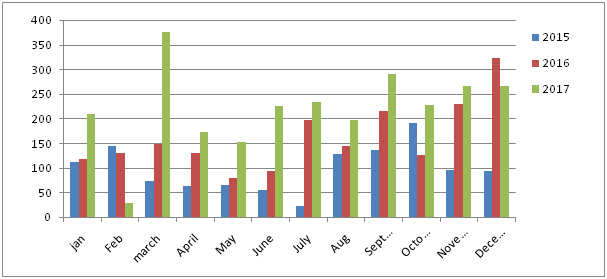
As would be appreciated from the above charts, the number of FERs issued in 2015 in each category of patents i.e. electronics, Mechanical, Chemistry and Biotechnology as shown in Figs.5-8 is less than 500 Applications in each month, which is very low, considering that there are Four Patent Offices in India taking care of the geographical extent of the country. The graphs in Figs. 9-12 depict FERs issued in 2016, which shows moderate increase in the number of FERs being issued compared to 2015. It is pertinent to note that in the period of January to March 2017, the Offices showed the same performance as that of 2016. There were very few issuances of FERs in the month of April and May 2017 in all the four categories, probably due to implementation of the new Amended Patent Rules. However, the period from June to December 2017 has shown a huge rise in the number of Applications that has been examined by respective Patent Offices. The graphs, as provided in Figs. 13-16 show a considerable growth in the issuance of FERs as compared to the previous years. However, the efficiency of Delhi Patent Office and Chennai Patent Office has not increased significantly and these two offices seem to be largely consistent. The Mumbai Patent Office and the Kolkata Patent Office are positive examples of how the Patent Rule amendments have enhanced the competitiveness with respect to swift issuance of FERs.
CONCISE COMPARISON OF ISSUANCE OF FERs in 2015, 2016 AND 2017
|
Group
|
2015
|
2016
|
2017
|
|
Electrical
|
7186
|
7179
|
19734
|
|
Biotechnology
|
1498
|
1512
|
4179
|
|
Chemistry
|
6563
|
5116
|
15088
|
|
Mechanical
|
4338
|
5406
|
12888
|
|
Total
|
19,585
|
19,213
|
51,889
|
In the year 2017, 51,889 Examination Reports have been issued, while in the year 2016 and 2015, 19,213 and 19,585 FERs were issued, respectively. Therefore, the Patent Offices have demonstrated more than 2.5 times improvement in its competitiveness in a single year.
GRANTED PATENT
Fig. 17: number of patents granted in biotechnological domain
Fig. 18: number of patents granted in Electrical domain
Fig. 19: number of patents granted in Mechanical domain
Fig. 20: number of patents granted in Chemistry domain
By looking at fig. 17, it can be observed, with respect to the Biotechnological domain, that in the year 2015, IPO has only granted 174 patent applications, whereas 2016 witnessed a growth of about 50%, which makes it issuance (grant) of 264 patents. But IPO showed tremendous growth in granting patent to 486 applications in the year 2017.
Fig. 18 depicts number of Patents granted in 2015, 2016 and 2017 in respect of Electrical Domain, which shows that Patents granted in the year 2015 and 2016 were at par with a little variance in number of granted Patents, which was 350 and 381, respectively. It is evident from the graph that the number of Patents granted in the year 2017 is twice of what was granted in the previous years, i.e. 652 applications.
Number of Patents granted in 2015, 2016 and 2017 in Mechanical domain has been provided in fig. 19. It is pertinent to note that IPO in the year 2017 has granted 2091 Patents which is 42% and 44% more than Patent granted in the year 2015 and 2016 respectively.
Further, Fig. 20 shows the number of Patent granted in the span of three years in the field of Chemistry, which clearly shows a progressive growth of the work of IPO from the year 2015 to the year 2017. It can be observed that IPO only granted Patents to 1176 applications in 2015, which increased to 1932 applications in the year 2016 and lastly IPO raised its bar to grant Patent to 2643 applications in 2017.
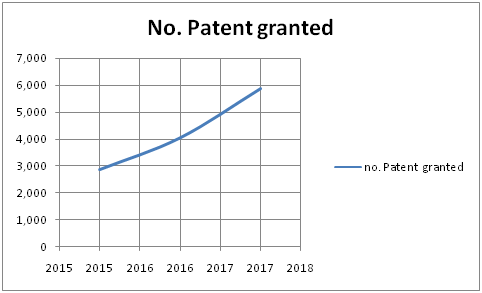
Fig.17 to 20-show number of Patents granted in 2015 to 2017 in each categories i.e. Biotechnological, Mechanical, Electrical and Chemistry. It can be observed that among all the three years, the number of patents issued was lowest in year 2015 followed by year 2016. Moreover, year 2017 has witnessed highest number of Patents that has been granted. This progressive growth of IPO in granting Patent hints towards a better and successful future in the field of invention and would be a strong incentive for inventors as well as foreign investors to invent and invest in India.
Author: Pratistha Sinha, Trademark Associate at Khurana&Khurana, Advocates and IP Attorneys. In case of any queries please contact/write back to us at pratistha@iiprd.com.

